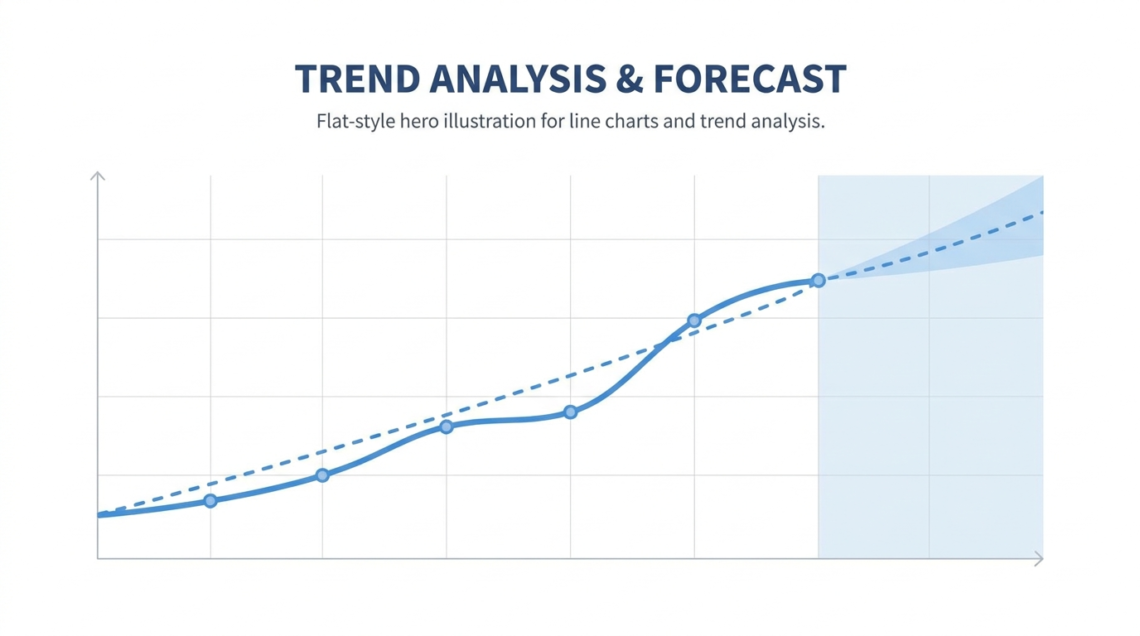
Line charts are the default visualization for anything that changes over time. Revenue by month, website traffic by week, customer churn by quarter: if the x-axis is a date and the y-axis is a metric, you’re probably looking at a line chart. The reason is ergonomic: the human eye follows…